

Soil Moisture Portal Guide
Portals for visualizing and downloading soil moisture data vary widely in their accessibility and usability. Some portals allow a cursory glance at the data to get the most recent conditions, while others oblige you to download the data and create your own visuals. Here we will share a few portals where you can find our data from the Roaring Fork Observation Network, as well as data from sister networks like the USGS and NWCC stations located in the Roaring Fork Valley that have soil moisture data available. The iRON has the longest soil moisture record in the Roaring Fork watershed, but the other networks have installed soil moisture sensors over the last couple of years, expanding the ability to get a fuller picture of soil moisture in the watershed.
Synoptic Dataviewer
USGS
NRCS NWCC
Synoptic Dataviewer
Summary
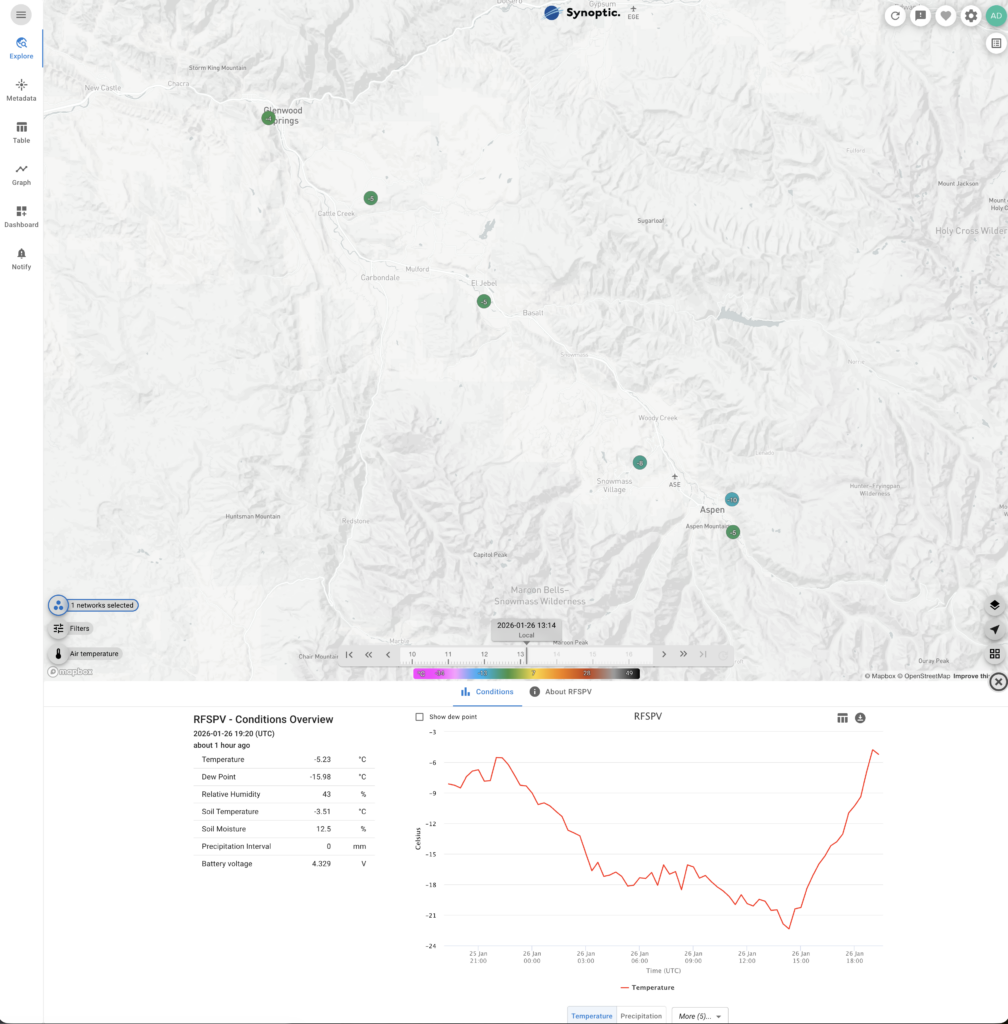
The Synoptic Dataviewer has an extensive station and network database, including the Roaring Fork Observation Network (iRON). The iRON went live on Synoptic in 2024. The data viewer provides graph and table views of the available data, as well as the ability to download data in CSV format.
Upside
The data viewer lets you quickly explore conditions at any location where data is available. You can easily and quickly see the conditions of each station with the Conditions Overview option that appears at the bottom of the map, and you can go into the Graph tab and create some more complex graphs. It also lets you create a dashboard to save all the stations you want to keep an eye on, so you can see them all in one place.
Downside
Though you can make some graphs, they are pretty rudimentary and can only show you the past 7 days. Great for recent conditions, but lacks any statistical tooling. The data download tool allows downloading data from only one station at a time, which can make downloading data for an entire region arduous. More complete access to services costs money.
Variables
View Variable Table
| Sensor | RFNSA | RFNST | RFSKM | RFSMM | RFBRC | RFSPV | RFGLR | RFGLS | ASEC2 | IDWC2 |
|---|---|---|---|---|---|---|---|---|---|---|
| Air Temperature | ✓ | ✓ | ✓ | ✓ | ✓ | ✓ | ✓ | ✓ | ✓ | — |
| RH | ✓ | ✓ | ✓ | ✓ | ✓ | ✓ | ✓ | ✓ | ✓ | — |
| Dewpoint | ✓ | ✓ | ✓ | ✓ | ✓ | ✓ | ✓ | ✓ | ✓ | — |
| Rain | ✓ | — | ✓ | ✓ | ✓ | ✓ | ✓ | ✓ | ✓ | ✓ |
| Soil Temperature | 8in | 8in | 8in | 8in | 8in | 8in | 8in | 8in | 2,8,20in | 2,8,20in |
| Soil Moisture | 2,8,20in | 2,8,20in | 2,8,20in | 2,8,20in | 5,8,20in | 5,8,20in | 2,8,20,50in | 2,8,20in | 2,8,20in | 2,8,20in |
| Other | — | — | — | — | — | Two sets of soil moisture sensors | — | — | Wind speed and direction, SWE, snow depth, radiative balance | — |
Visualizations
Simple graphs and tables
How-to guidance
Documentation available in upper left of Dataviewer
USGS Water Data
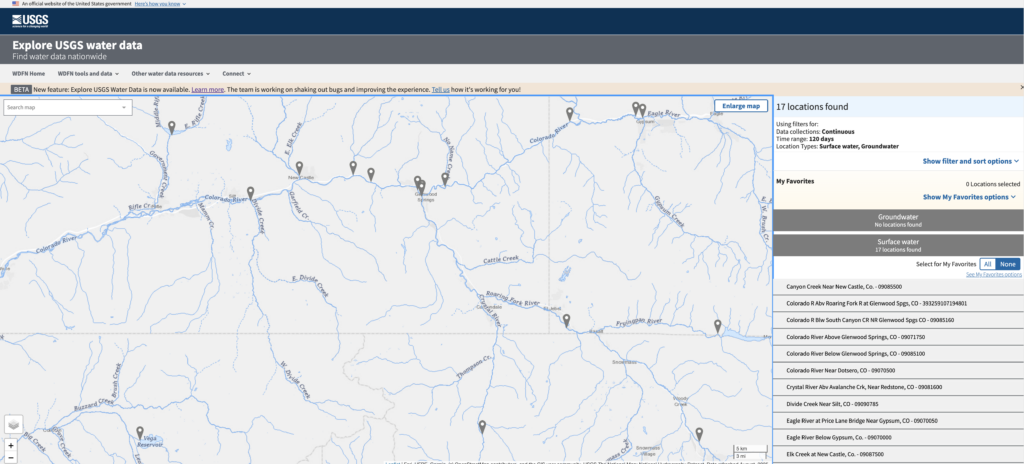
The USGS Water Data portal has a wide selection of data available, including soil moisture. A lot of the soil moisture infrastructure is new in the Roaring Fork Valley, but it is still valuable data. Among the available data, snow depth and snow water equivalence and stream gauge data are also available. This allows for a deeper look into the hydrological status of the Roaring Fork Valley. Link.
Upside
With such an extensive network, the amount of data you can retrieve from the portal is immense, allowing you to get a more comprehensive look at the meteorological and hydrological state of the Roaring Fork Valley as well as other parts of Colorado and the US.
Downside
The data download tool that is easily available on each stations page only allows you to download the past seven days of data. In order to get historical data you will need to use the USGS Water Data API or the USGS dataRetrieval package for R.
Variables
View Variable Table
| Sensor | Code | Unit | Independence Pass | Hunter Creek | Other 15 stations |
|---|---|---|---|---|---|
| Air Temperature | 20 | °C | ✓ | ✓ | ✓ (all) |
| Relative Humidity | 52 | % | ✓ | ✓ | ✓ (all) |
| Barometric Pressure | 00025/75969 | mmHg/mbar | ✓ | ✓ | ✓ (13/15)* |
| Soil Temperature | 72253 | °C | ✓ | — | ✓ (most) |
| Soil Moisture | 74207 | % vol | ✓ | — | ✓ (most) |
| Cosmic Ray Neutrons | 72431 | count | — | — | ✓ (14/15) |
| Wind Speed | 35 | mph | ✓ | ✓ | — |
| Wind Direction | 36 | deg | ✓ | ✓ | — |
| Wind Gust Speed | 61728 | mph | — | ✓ | — |
| Shortwave Radiation ↓ | 72186 | watt/m² | ✓ | ✓ | — |
| Shortwave Radiation ↑ | 72185 | watt/m² | ✓ | ✓ | — |
| Longwave Radiation ↓ | 72175 | watt/m² | ✓ | ✓ | — |
| Longwave Radiation ↑ | 72174 | watt/m² | ✓ | ✓ | — |
| Snow Depth | 72189 | m | ✓ | ✓ | — |
| Snow Water Equivalent | 72341 | mm | ✓ | ✓ | — |
| Snowpack Density | 72392 | kg/m³ | ✓ | ✓ | — |
| Liquid Water Content (snowpack) | 72393 | % vol | ✓ | ✓ | — |
| Drifting Snow Flux | 72394 | g/m²/s | ✓ | ✓ | — |
| Surface Temp (non-contact IR) | 72405 | °C | ✓ | ✓ | — |
Visualizations
Each station has the ability to graph either one variabe, or two.
How-to Guidance
In the Connect dropdown menu, there are tutorials and explainers in the Water Data for the Nation Blog
NRCS NWCC
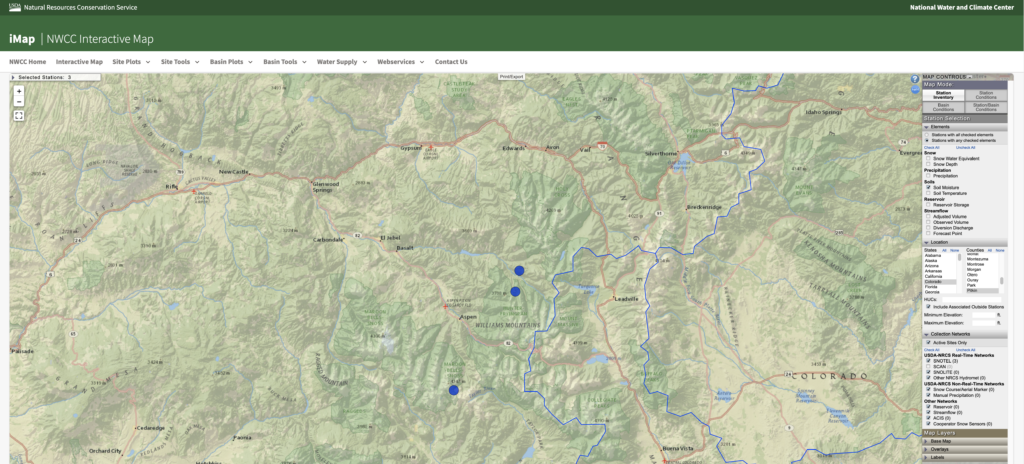
The Natural Resources Conservation Service: National Water and Climate Center portal offers access to stations throughout the Roaring Valley Valley, Colorado, and other states. The interactive map has comprehensive filters, making it easy to find what you need, and the accompanying Report Generator offers comprehensive data selection, report generation, and visual creation.
Upside
The interactive map and its filter options allow you to get to the stations and data you need relatively easily. Each station has rich metadata and easy reporting, even allowing full historical data exports. The report generator allows in-browser data exploration and the download of generated visuals.
Downside
The report generator outputs via your browser as comma-separated values or HTML, rather than as a downloadable CSV or other file type. To save the data, export it as a text file from your browser and import it into a program like Excel or Modern CSV.
Variables
View Variable Table
| Code | Description | Unit | Chapman Tunnel | Kiln | Castle Peak | Hourly |
|---|---|---|---|---|---|---|
| BATT | Battery Voltage | volt | ✓ | ✓ | ✓ | ✓ |
| BATX | Battery Voltage Max | volt | ✓ | ✓ | ✓ | ✓ |
| DIAG | Diagnostics | unitless | — | — | ✓ | ✓ |
| LWINV | Longwave Incoming Radiation | watt/m² | — | — | ✓ | ✓ |
| LWOTV | Longwave Outgoing Radiation | watt/m² | — | — | ✓ | ✓ |
| PRCP | Precipitation Increment | in | ✓ | ✓ | ✓ | — |
| PRCPMTD | Precipitation Month-to-Date | in | ✓ | ✓ | ✓ | — |
| PRCPSA | Precipitation Snow-Adjusted | in | ✓ | ✓ | ✓ | — |
| PREC | Precipitation Accumulation | in | ✓ | ✓ | ✓ | ✓ |
| PTEMP | Profile Temperature (18 depths) | degF | — | — | ✓ | ✓ |
| RHUM | Relative Humidity | pct | — | — | ✓ | ✓ |
| RHUMN | Relative Humidity Min | pct | — | — | ✓ | ✓ |
| RHUMV | Relative Humidity Average | pct | — | — | ✓ | ✓ |
| RHUMX | Relative Humidity Max | pct | — | — | ✓ | ✓ |
| SMN | Soil Moisture Min (5/5/4 depths) | pct | ✓ | ✓ | ✓ | — |
| SMS | Soil Moisture (5/5/4 depths) | pct | ✓ | ✓ | ✓ | ✓ |
| SMV | Soil Moisture Average (5/5/4 depths) | pct | ✓ | ✓ | ✓ | — |
| SMX | Soil Moisture Max (5/5/4 depths) | pct | ✓ | ✓ | ✓ | — |
| SNDN | Snow Density | pct | ✓ | ✓ | ✓ | — |
| SNRR | Snow Rain Ratio | unitless | ✓ | ✓ | ✓ | — |
| SNWD | Snow Depth | in | ✓ | ✓ | ✓ | ✓ |
| SRAD | Solar Radiation | watt/m² | ✓ | — | — | ✓ |
| SRADN | Solar Radiation Min | watt/m² | ✓ | — | — | ✓ |
| SRADV | Solar Radiation Average | watt/m² | ✓ | — | — | ✓ |
| SRADX | Solar Radiation Max | watt/m² | ✓ | — | — | ✓ |
| STN | Soil Temperature Min (5/5/4 depths) | degF | ✓ | ✓ | ✓ | — |
| STO | Soil Temperature (5/5/4 depths) | degF | ✓ | ✓ | ✓ | ✓ |
| STV | Soil Temperature Average (5/5/4 depths) | degF | ✓ | ✓ | ✓ | — |
| STX | Soil Temperature Max (5/5/4 depths) | degF | ✓ | ✓ | ✓ | — |
| SWINV | Shortwave Incoming Radiation | watt/m² | — | — | ✓ | ✓ |
| SWOTV | Shortwave Outgoing Radiation | watt/m² | — | — | ✓ | ✓ |
| TAVG | Average Temperature | degF | ✓ | ✓ | ✓ | ✓* |
| TMAX | Max Temperature | degF | ✓ | ✓ | ✓ | ✓* |
| TMIN | Min Temperature | degF | ✓ | ✓ | ✓ | ✓* |
| TOBS | Observed Temperature | degF | ✓ | ✓ | ✓ | ✓ |
| WDIRV | Wind Direction | degree | — | — | ✓ | ✓ |
| WSPDV | Wind Speed | mph | — | — | ✓ | ✓ |
| WSPDX | Wind Speed Max | mph | — | — | ✓ | ✓ |
| WTEQ | Snow Water Equivalent | in | ✓ | ✓ | ✓ | ✓ |
| WTEQX | Snow Water Equivalent Max | in | ✓ | ✓ | ✓ | — |
| ZDUM | Dummy Voltage | volt | ✓ | ✓ | — | ✓ |
*TAVG/TMAX/TMIN hourly only at Castle Peak.
Visualizations
The NRCS NWCC Report Generator allows for comprehensive visual creation and exporting. All variables at a station are available to graph, and can be graphed against each other.
How-to Guidance
In the upper right of the Interactive Map, there is a help button that takes you to a comprehensive guide to using the map. In the upper right of the Report Generator page, there is a help and tutorial guide that helps walk you through using the tools.