Lessons Learned:
Lessons from running the Roaring Fork Observation NetworkLessons from running the Roaring Fork Observation Network
Sharing our experience from 14 years of operating a community-supported, high-elevation soil moisture network
Background
Environmental monitoring provides the foundation for understanding how watersheds respond to changing climate and environmental conditions, yet the practical knowledge required to build, sustain, and fund monitoring networks rarely makes it into peer-reviewed literature. This document attempts to fill this gap, drawing on over 14 years of operating the Roaring Fork Observation Network (iRON) in the Rocky Mountains of western Colorado.
The iRON was born out of a 2012 science workshop convened to explore how a coordinated observation network could support ecological and bioclimatic monitoring across the Roaring Fork Watershed, a headwaters catchment in the upper Colorado River Basin. Soil moisture emerged as a priority monitoring parameter because it is a key factor in understanding forest and watershed health, and soil moisture monitoring networks in complex, mountainous terrain were scarce. This insight launched the development of a ten-station network that spanned the elevational gradient and ecotypes of the Roaring Fork Watershed. In the past 14 years, the iRON and AGCI have forged partnerships, maintained stations, built funding networks, and operated a successful community-supported environmental monitoring network.
The lessons gathered here are organized around three phases of network development: (1) design and installation, (2) operations and maintenance, and (3) data management. We aim to provide insights for practitioners and researchers embarking on similar efforts.
Design and Installation
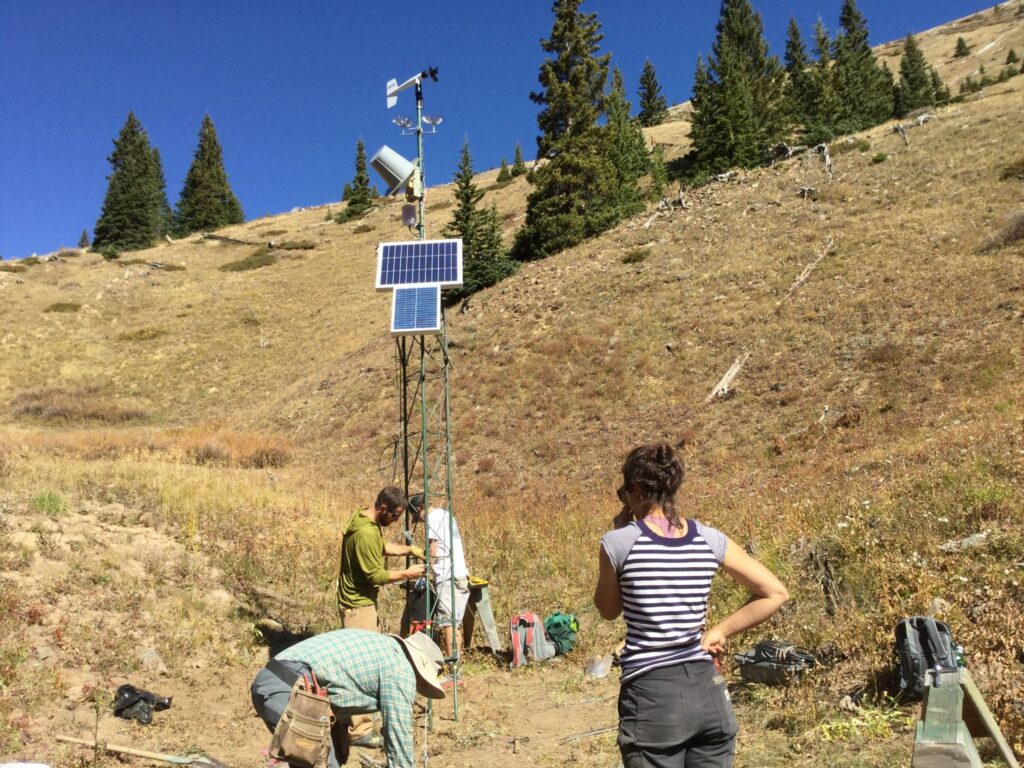
Partners are not just funders but essential collaborators in getting stations installed and live. For the iRON, most stations are sited on county, private, or conservation preserve land, and land-use agreements for station deployment hinge on partner relationships. In addition to land use agreements and access, partners helped shape site selection by identifying locations meaningful to their management decisions and by flagging additional sensors useful to their decision-making processes beyond the iRON’s default sensor suite. This early and sustained partner involvement has enabled a network that both operates as a whole and provides station-specific information useful to partners.
Key ways in which partners were engaged during the planning and installation process of the iRON are:
-
- Involved partners in site selection
-
- Worked with partners to navigate site access and permissions
-
- Worked alongside partners to understand data needs for sensor deployment
-
- Brought partners to installation days when possible.
Site selection for the iRON was driven by a first-order objective of spanning the elevational gradient of the Roaring Fork Watershed and representing distinct ecological zones (many of which are a function of elevation). That goal was constrained by the need for landowner permissions and funding, so the iRON network grew at a pace limited by partnership and permissions.
Once key elevations and ecosystems were identified, the iRON team worked with partners to identify sites on accessible land that met criteria and to develop each station’s specific site needs.
The iRON used criteria to guide site selection:
| Criteria | Siting Questions |
| Ecological and elevational representativeness | Does this site capture a distinct ecological zone or elevation band not covered by existing stations? |
| Access and permissions | Can we realistically reach this site for maintenance, and can we secure long-term land access? Is the station far enough from high-traffic areas to remain undisturbed? |
| Partner Utility | Does this location produce data that supports a partner’s management or research needs? |
An ongoing challenge for some iRON stations is winter access. Two of the ten iRON stations are located above avalanche-prone terrain and can be complex to access for winter maintenance.
The continuous iRON data record from 2012 to present owes its success to partnerships and scientific research funding in equal measure. From the onset, the funding strategy centered on identifying organizations that have a direct stake in understanding and managing the watershed (e.g., land managers, municipal water utilities, county open space programs, and conservation organizations). These partners provide legitimacy, access to land, and guidance for the network in addition to funding for core operations.
The iRON has found key partners across the Roaring Fork Watershed:
-
- Land managers responsible for conservation areas, trails, or wildlife habitat with specific environmental data needs
-
- Municipal water managers in watersheds where iRON data can inform allocation and forecasting decisions
-
- Counties and open space programs that own or manage lands where stations could be sited
-
- Research institutions that can provide credibility, staff capacity, funding partnerships, and scientific inquiry
There has been an ongoing balancing act between short-term deliverables and long-term monitoring for the iRON. The most actionable insights come from long-term records, but intentionally placed stations can also deliver near-term value to partners with specific management needs.
The equipment for each station was chosen based on its cost, usability, and maintenance requirements. The iRON started with the Onset (now Licor) Hobologger system. This system is an agriculturally oriented platform chosen for its low barrier to entry, plug-and-play sensors, and user-friendly dashboard. That choice has been remarkably durable for the network; however, expanding into remote, high-altitude sites exposed the limits of building around a plug-and-play sensor ecosystem, and data was lost due to equipment failures. A desire for a more robust data logger system led the iRON team to explore other systems over the duration of the network, including Datagarrison, StevensWater/Connect, and Campbell Scientific.
| System | Strengths | Weaknesses |
| Licor (formerly Onset) Hobologger | Easy setup, reliable data collection, GUI dashboard, cellular telemetry | Proprietary sensors, limited third-party compatibility, requires cellular service |
| Datagarrison | Satellite telemetry, compatible with Onset sensors | Limited sensor ports, port expander caused data loss and communication failure |
| Stevens Water/Connect | GUI dashboard, responsive support team, satellite telemetry | Failed in extreme cold, lost data during winter months |
| Campbell Scientific | Robust in harsh environments, highly expandable, satellite telemetry | High cost and complexity, requires more technical expertise |
Given the iRON’s experience with equipment selection, key suggestions include:
-
- Match the hardware to the environment. Standard agricultural or consumer-grade loggers are not designed for harsh, high-altitude environments. Budget for purpose-built systems if deploying sensors above the treeline or in extreme cold
-
- Understand the sensor ecosystem before committing. Proprietary “smart sensor” systems simplify the setup, but can limit options as data needs evolve.
-
- Plan for a growing sensor load. Exceeding a logger’s default port capacity, even with expanders, can cause failures and data loss.
-
- Prioritize systems with reliable remote diagnostics or invest in building these tools. User-friendly dashboards showing live data streams and transmission flags can be useful for remote, hard-to-access stations. After years of using third-party dashboards, the iRON team built its own dashboards to streamline the process.
It is important to define the core data needs first, and to select sensors that meet these objectives while allowing for operational flexibility. The iRON’s core sensor suite includes air temperature, relative humidity, rainfall, soil moisture at depths of 5, 20, and 50 cm, and soil temperature at 20 cm. This simple set of core measurements balances scientific value with ease of maintenance. Additional sensors added to stations to enable additional data analysis include radiative balance, snow-water equivalent, snow depth, and wind speed and direction. Most iRON stations sample at 20-minute intervals, which allows for moderate resolution without requiring high battery capacity or an additional power supply beyond the solar panel.
A consistent challenge the iRON faced was underestimating the actual cost of running a monitoring network. Early cost estimates were low and comparable, but reliable cost benchmarks to show funding partners were hard to find. As a result, AGCI has absorbed costs that would ideally have been covered by partner funding, which constrained the network’s growth, maintenance, and data management processes, especially in the early years.
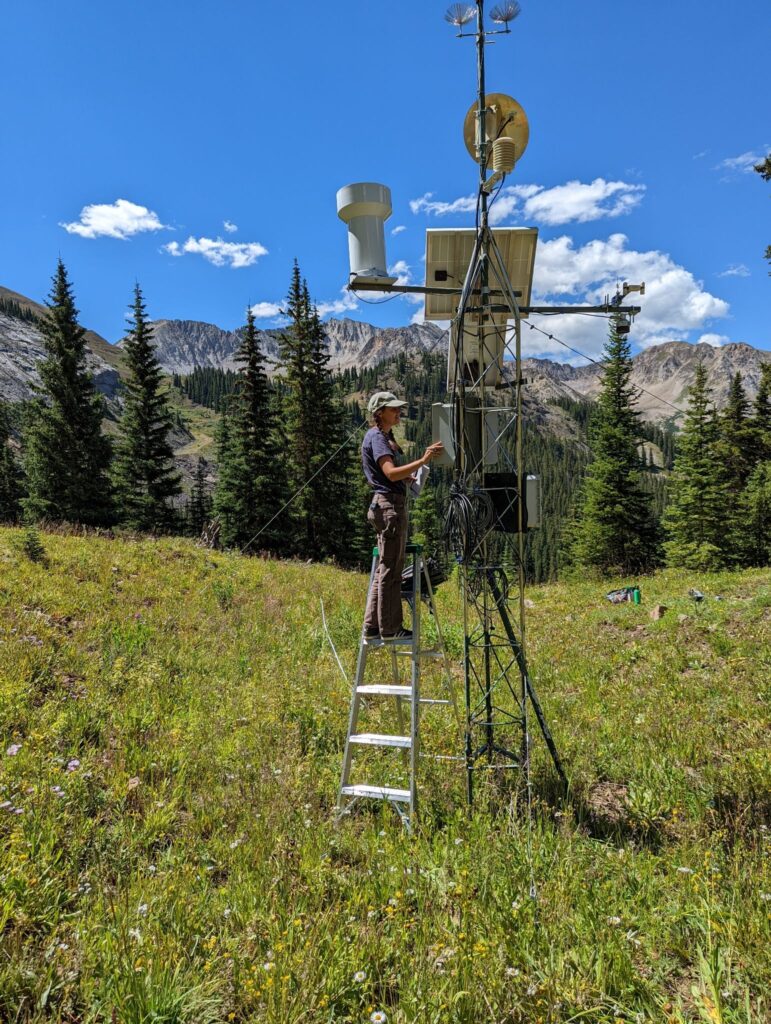
Operating with limited resources has had upsides (increased creativity) and downsides (limited maintenance, data management, and analysis). Because the iRON receives funds from community organizations, we have engaged more with the community than a typical monitoring network. This includes attending community science and watershed events, hosting local high school and university students as interns, working in partnership with conservation groups on management plans, and supporting local decision-makers with actionable information at critical times. This strategy has also given the community and interns an opportunity to join us in the field and experience what it takes to manage a meteorological and soil moisture monitoring network, providing context and insights into the importance of such a network existing in a critical watershed. In some cases, it has driven past interns to pursue education and careers in similar work.
Some key lessons in budget prioritization and development throughout the history of the iRON are:
-
- Data management time has consistently been underestimated throughout the iRON’s history.
-
- Building data infrastructure early pays off. Retrofitting the data management system multiple times after years of data collection is more time-consuming (and costlier) than building a robust data management infrastructure from the start.
-
- Limited budget drives creativity and prioritization. It is critical to know which elements of the network are essential and which are luxuries.
Installation timelines are driven by physical site access and the complexity of the instrumentation.
Ideal station sites may lack vehicle access, requiring labor-intensive human-powered installation and maintenance. Beyond installing a tower or tripod, sensor deployment can be time-intensive. Calibration and troubleshooting of the electronic components often require extended periods of fine-tuning to ensure data integrity. Many iRON station installations were deployed in a single day. This was possible due to the simplified nature of the chosen data loggers. However, for our high-altitude, more complex logger systems, attempts to set these stations up in one day led to long days and field fatigue, as well as sensor data integrity issues after installation.
To prevent schedule overruns, reduce field fatigue, and ensure data integrity, breaking up the installation into stages could help. Below are some suggestions for breaking up an installation.
| Stage One | Stage Two |
| Equipment transport (tower, tripod, hardware) Site preparation (digging pits for tower and sensors) Tripod/tower installation |
Sensor placement attachment Datalogger setup and programming Telemetry setup System tests and troubleshooting |
Operations and Maintenance
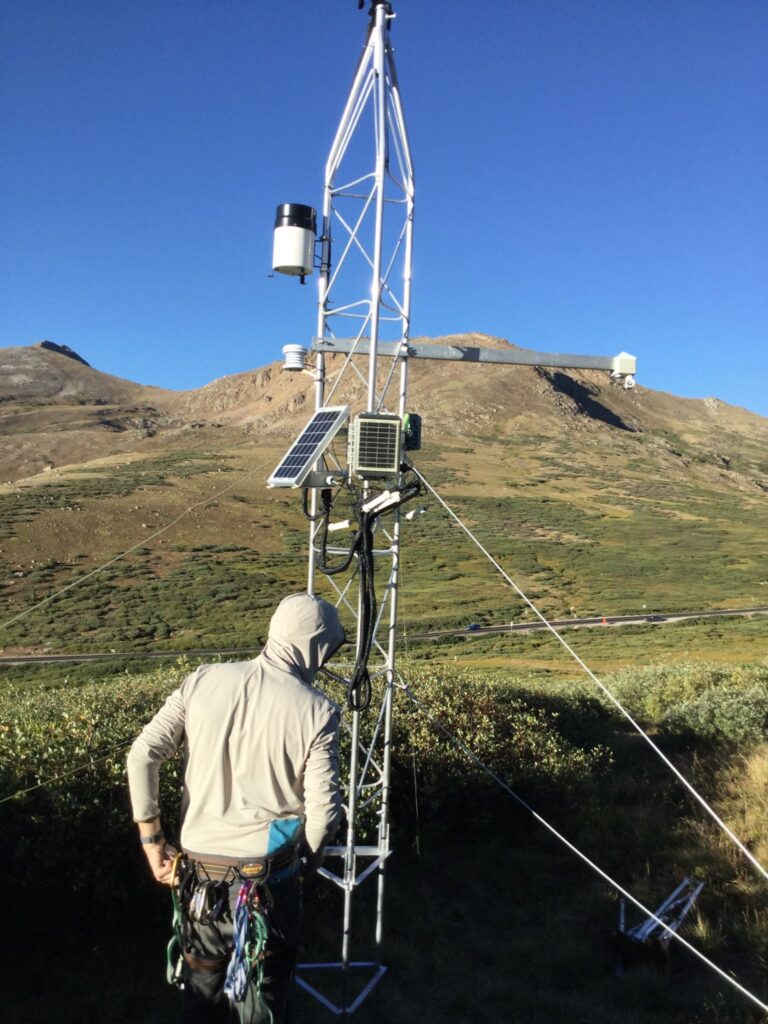
Comprehensive field notes have been invaluable to the iRON’s operations and data management. Since station maintenance tasks can accidentally change routine data pipelines or introduce errors (or additional measurement frequency) to data logs, clear documentation of timing and activities is critical. The iRON team follows a rule: if you touch the station, document what you touched, what you did, and why. This documentation needs to be accessible to all team members and collated effectively throughout the station record.
Typical field notes for a station visit capture:
- Date and time of visit
- Who was present
- The initial reason for the visit (planned ahead of the visit)
- The station’s condition upon arrival
- The work performed
- The station’s condition after the visit (upon departure)
Preventive maintenance minimizes downtime and improves data continuity for the network. Moreover, calibration of different soil moisture probes requires substantial overlapping records to account for site-specific differences in absolute soil moisture conditions. Developing a proactive maintenance plan is critical to ensuring continuity of the data record across multiple sensors installed throughout the station’s lifetime.
The iRON started operations under a run-to-failure maintenance strategy, which introduced data gaps and limited the network’s continuity through time due to sensor replacements. However, this strategy allowed the network to persist through periods of limited funding and contributed to the long-term record. Data processing techniques such as standardization can help bridge sensor changes within a given station’s history. This record continues to support research, inform partners and the local community about watershed conditions, and provide insights that require a long-term record.
Data Management
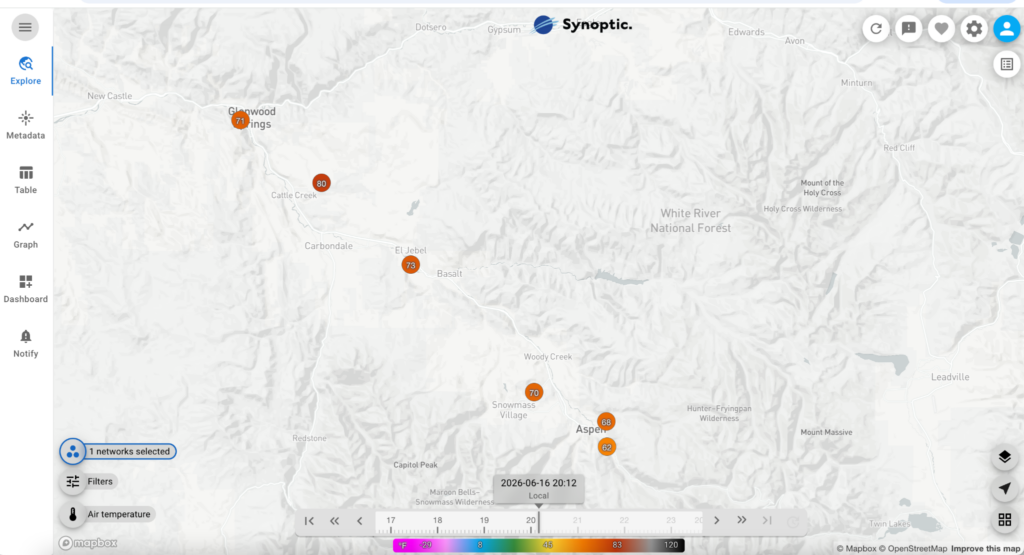
Investing in data management early can prevent complications. The iRON built a data system after the network was operational, which contributed to duplicative data storage processes, inefficient data handling, and difficulty in tracking QA/QC datasets. The iRON transitioned to a more formalized data management framework including internally built data pipelines and databases that improved data accessibility, interpretability, and quality. However, the iRON eventually leveraged the Synoptic Data API, where observations are currently hosted alongside other similar datasets. This approach reduced maintenance burden, increased data visibility, and promoted interoperability across similar soil moisture networks.
Key elements of the iRON data management system include a master labeling schema, standardized units, a near real-time data pipeline, a data storage and backup plan, and standardized data and metadata formats.
A summary of current data management systems by soil moisture networks is below.
| Data Provider | Data Hosting | Network Information |
| USGS NGWOS | USGS Data Release | Nationwide hydrological monitoring network providing streamflow, groundwater, meteorological, and soil moisture observations |
| NRCS SNOTEL & SCAN | NRCS Data Viewer | Nationwide monitoring networks providing long-term snowpack, precipitation, soil moisture, and climate observations |
| Scripps CW3E Mesonet | Synoptic Data Viewer | Regional meteorological network providing weather and soil moisture observations in Colorado and California |
| USGS Canyonlands Research Station | Synoptic Data Viewer | Regional monitoring network providing soil moisture and meteorological observations across dryland ecosystems of the Colorado Plateau |
| RAWS Mesonet (BLM) | Synoptic Data Viewer | Regional monitoring network providing weather and soil moisture observations |
| iRON | Synoptic Data Viewer | Watershed-scale monitoring network providing long-term soil moisture and meteorological observations in the Roaring Fork Watershed |
| NOAA USCRN | NOAA Data Viewer | Nation-wide climate reference network providing long-term meteorological and soil moisture observations |
| CoAgMet | CSU Data Viewer | Statewide agricultural monitoring network providing long-term weather and soil moisture observations across Colorado. |
Environmental monitoring networks can be used in aggregate, and numerous efforts are underway to amplify data usage by collating multiple datasets into single locations. By adopting common data standards and participating in shared data platforms, networks can become part of a broader ecosystem of observations that is more powerful than any single dataset alone.
Data from the iRON have been integrated into two larger repositories, increasing the visibility and accessibility of the network by allowing users to discover iRON data alongside observations from other soil moisture, weather, and hydrologic networks.
- Quantification of Uncertainty in Ecosystem Networks through Community Harmonization (QUENCH).
- “QUENCH brings together soil moisture and weather information from networks across Colorado.”
- The International Soil Moisture Network (ISMN).
- “The ISMN is a global data hub for in situ soil moisture observations. It integrates and harmonizes measurements collected from a wide range of networks and institutions worldwide, providing open access to quality-controlled data in a standardized format.”
For smaller monitoring programs, like the iRON, these partnerships provide an important opportunity to extend the impact of local observations. Contributing data to community repositories (even those that update annually rather than in real time) and adopting shared standards reduces duplication of effort, promotes interoperability, and allows individual networks to contribute to regional, national, and global understanding of environmental change.
Quality assurance and quality control (QA/QC) are critical elements to a usable and informative dataset. Community guidance such as the National Coordinated Soil Moisture Monitoring Network’s “Soil Moisture Data Quality Guidance” emphasizes the importance of standardized metadata, documented QA/QC procedures, routine maintenance, and automated quality checks. These rigorous standards allow for cross-comparison between networks and for broader data application.
The iRON’s QA/QC practices evolved alongside the network as new community standards emerged. Aligning with these broader frameworks has improved the transparency and usability of the iRON data while facilitating intercomparison with other soil moisture networks.